The exclusive AI indicators, the live liquidation map and the tools the pros use - built on data no other chart has. One membership unlocks all of it.
Premium includes 5 Ask AI reads on your charts every day. It is the one feature that costs us money every time it runs, so Premium AI+ is what raises it to 50 a day - now $119 a month, $40 off.
YOUR MEMBERSHIPPREMIUM
Premium is active on your account
Checking your plan…
Pay with crypto · BTC, USDT & moreNo auto-renewalInstant access
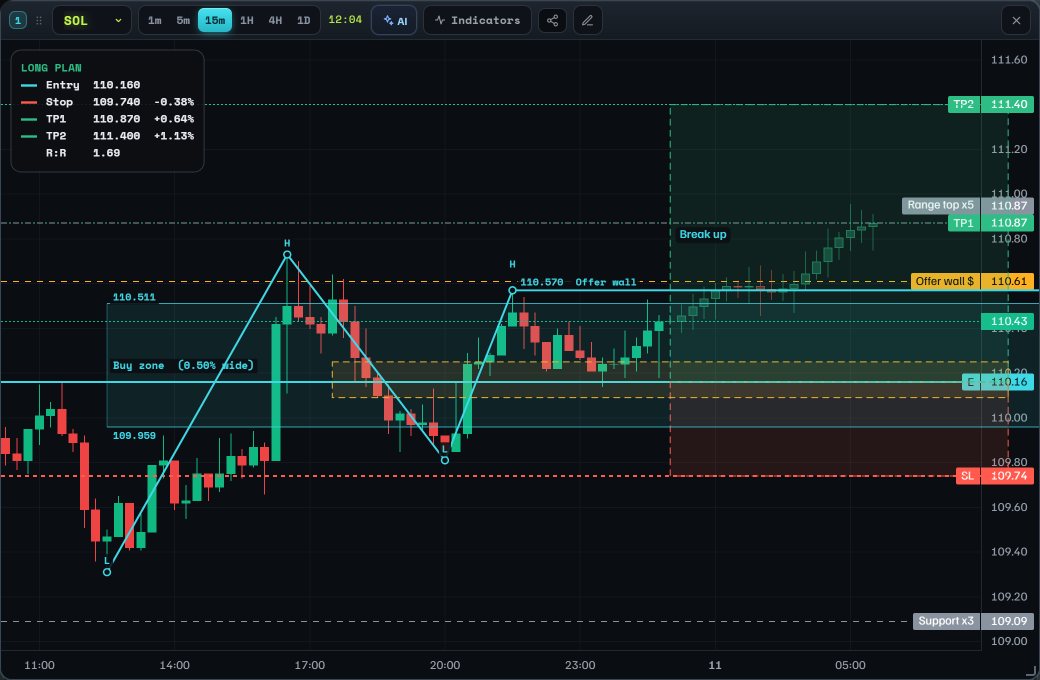
ASK AI, ON A REAL CHARTSOL · 15m · untouched, as it came out
“Where would you enter, and where does the stop go? Draw it.”
Entry
110.16 -0.24% from the price when asked
Stop
109.74
Target
110.87
Reward to risk
1.69
It read the chart, drew 3 shapes on it and printed the arithmetic. One of your Premium reads, every day.
Eleven upgrades that turn MarginPad from a chart into an edge.
EXCLUSIVE
6 AI indicators
Cascade Radar, Liquidation Magnet, Market Brain, Market Memory, Big Liquidations and What moved it - six readouts built on data no other chart has. The newest flags every abnormal move of the last 30 days with its cause: dated news, a liquidation cascade, a whale, a BTC move, or an honest question mark. One of them is not a model at all: it marks every big liquidation of the last 24 hours on the exact candle and price it happened on, from our own feed across eight exchanges, and a tap on any circle opens the size, the side and the venue. Each one carries a card that reads its state in words, and a tap explains it before a long and before a short.
What each one tells you →
EXCLUSIVE
Live liquidation heatmap
See exactly where leveraged positions get wiped and which levels price is hunting next - the map Coinglass charges $300/mo for, unlimited.
EXCLUSIVE
Ask AI on your charts
A built-in analyst that reads any chart in plain words and works the chart for you: say "draw the setup" and it draws trendlines, zones and the expected path with the real drawing tools; ask "what is RSI?" and it explains it and switches it on. It can change the timeframe or coin, knows our five indicators, keeps the conversation per coin, and offers one tap to paper-trade the setup. Five reads a day on Premium, 50 a day on Premium AI+.
Seconds charts: 1s, 5s, 15s, 30s
Second-by-second candles in the Paper Trade terminal and on Charts, plus the 3m, 30m, 2h, 6h and 12h frames. The one-second candle is Bybit’s own and the forming bar is built from the same trade stream the live price comes from, so what you see is the market, not a smoothed line. Roughly a day of history, crypto perpetuals only.
Balance Mode
Give yourself a portfolio balance and trade it like a real account. Balance, equity and available margin live right in My Trades.
Premium duels
Challenge any trader to all 5 duel formats - Profit, Survival, Streak, Sniper and ROE - stake Ticks and win the pot. Free members only get the basic ROE duel.
Premium chat lounge
A members-only chat room where only Premium traders can talk - away from the noise, with your gold name on show.
Daily Brief
A morning snapshot of the majors - 1H & 4H trend, RSI and the next high-impact macro events, in one glance.
+5% XP on everything
Level up faster on every trade, lesson and mission - Premium earns a permanent 5% XP boost.
Premium badge & gold everything
A gold Premium badge next to your name in every chat and leaderboard, a premium-styled trader card, matte-black gold tickets and gold share images for your trades.
Position alerts
A price alert tells you a coin hit a number. These tell you what only we can see, because we hold your positions: liquidation closing in, a stop or target about to trigger, a limit order about to fill. Browser push and Telegram, with the distances you choose. Set them up →
Your trading report
How you actually traded, measured from your own closed trades: win rate and return by coin, by leverage band and by hour of day, median hold time, and the sentence that explains the month - "your 50-100x trades return -5.7% on margin risked, your 1-5x return -0.3%". See yours →
THE CHART READS ITSELF
Every indicator says what its line means, right where the line is
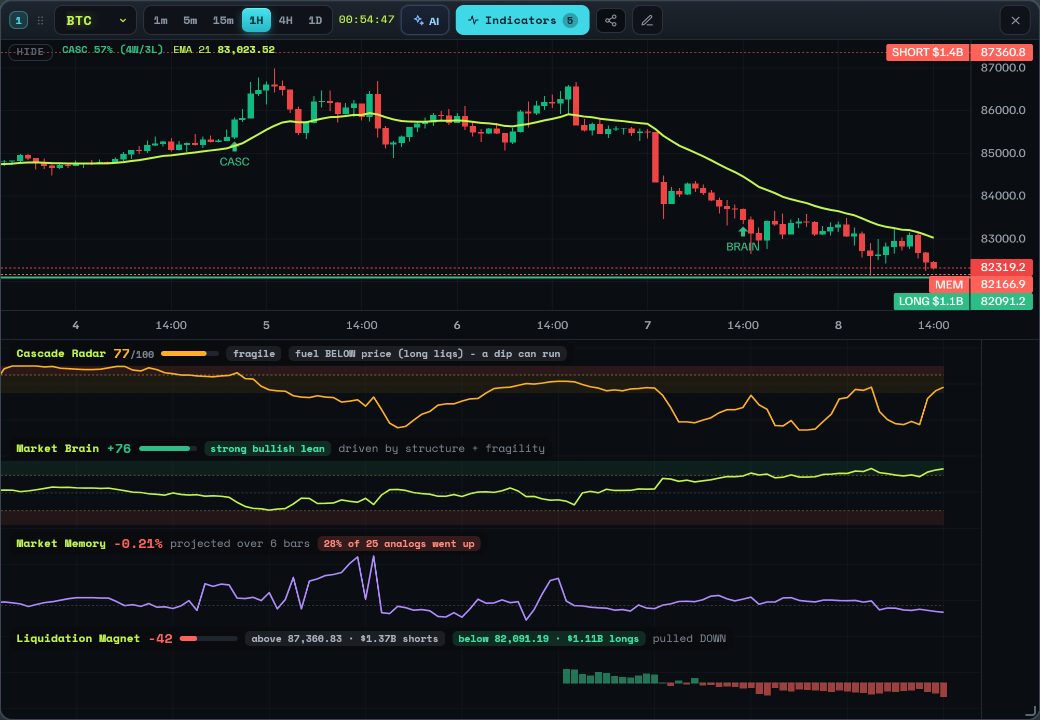
A real capture of BTC on the 1-hour chart with the four MarginPad indicators on. Each band carries a card with its value and the state a trader acts on - overbought or oversold, a cross and how many candles ago, a divergence against price, where the liquidation fuel sits, what is driving the Brain. Tap any card and the indicator explains itself: what you see, what it means, before a long, before a short.
Captured 2026-10-08 12:06 UTC. The cards below are the cards in the picture.
Cascade Radar77/100fragile · fuel BELOW price (long liqs) - a dip can run
Market Brain+76strong bullish leandriven by structure + fragility
Market Memory-0.21%28% of 25 analogs went upprojected over 6 bars
Free members get every standard indicator with the same cards. Premium adds the six MarginPad readouts above, built on our own liquidation data and the Catalyst Engine. Also new on every chart: bar replay, compare with a second coin, trading sessions, daily levels, six chart styles.
Building a bot? The Bot API is its own product with its own Free, Pro, Max and Business plans since 15 September 2026 - Premium does not change any API limit, and an API plan does not unlock the features above. See the API plans →
PRICING
Pick your plan
Same full toolkit either way. Pay in crypto - nothing stored, nothing shared.
PREMIUM
$11.99 / month
Every Premium upgrade on this page
30 days - nothing renews on its own
Instant access after payment
5 Ask AI reads a day on any chart
PREMIUM AI+ $40 OFF
$159$119 /month
Everything in Premium
Ask AI on your charts - 50 reads a day, against five on Premium
It reads measured data, not a screenshot
It draws the setup on your chart
Prices in USD, paid in crypto via NOWPayments. Educational paper-trading tools - not financial advice.
PREMIUM AI+
It does not look at your chart. It reads it.
Send a screenshot to a general chatbot and it guesses from pixels. Ask AI is handed the measurements: where the liquidation pools sit, how much volume traded at which price, whether this volatility is high or low for this market, what the higher timeframe is doing, and where the unfilled gaps are. Then it draws the setup on your chart with the same tools a desk uses.
It also carries the one directional edge we have actually measured in our own data - and no screenshot can see it. Across 84 days of our own liquidations, after a capitulation that force-sold longs (strongest when open interest is unwinding at the same time) price leaned higher over the next one to four hours - about 60% of the time against a 50% coin flip, and higher in a true capitulation. When that fires the assistant leads with it; when there is no measured edge it tells you so plainly and reads the chart honestly instead of inventing a direction. We do not claim it wins every call - we claim it knows the difference.
WHY THE TWO PRICES ARE SO FAR APART
Premium costs us nothing to serve. Ask AI costs money every time it runs.
Everything else on this site - the indicators, the heatmap, the alerts, the boards - is code we already wrote. It serves a hundred members as cheaply as one. Ask AI is different: each read sends a measured brief to a frontier model and pays for it.
What one read costs us
$0.018
Measured on our own bills, per question on average; a full-length read at the model ceiling costs $0.044. At the Premium AI+ ceiling of 50 reads a day that is $27 to $66 a month of model spend for one member - which is why it is the only thing here with a per-use price, and why Premium carries five reads a day rather than fifty.
What the data alone costs elsewhere
$299 /month
Coinglass Standard, from their own pricing page. Hobbyist $29, Startup $79, Standard $299, Professional $699 - and no tier on that page includes AI analysis. That is the data delivered to you; reading it is still your job.
What a general AI subscription sees
A screenshot
A chatbot has no liquidation pools, no volume-at-price, no funding, no open interest and no idea whether this volatility is high or low for this market. It guesses from pixels, and it cannot draw a line on your chart. Ours is handed the measurements and draws the setup.
Our figure is measured from our own API usage. Competitor prices are quoted from coinglass.com/pricing, checked 19 September 2026 - check it yourself before you compare. Nothing here is a claim about which product is better at what it does.
6 reads, as they came out
Untouched from the charts on 10 October 2026: the assistant picked the levels, drew them and printed its own verdict. Beside each capture is exactly what it did and every number it put on the chart - nothing retyped, and 4 of the 6 are a refusal to trade.
You askedWhere would you enter, and where does the stop go? Draw it.SOL · 15m
What it didDrew 4 shapes
LONGconfidence 58%
Entry
110.16 -0.24% from the price when asked
Stop
109.74 -0.38%
Target 1
110.87 +0.64%
Target 2
111.4 +1.13%
Reward to risk
1.69 acceptable
15-minute SOL is coiled — don't buy into the wall at 110.61.
It draws the trade and prints the arithmetic. Long from 110.16, stop 109.74, targets 110.87 and 111.4 - reward to risk 1.69 written on the block. On the chart: a level, a zone, a pattern, labelled “Offer wall”, “Buy zone”, “Break up”.
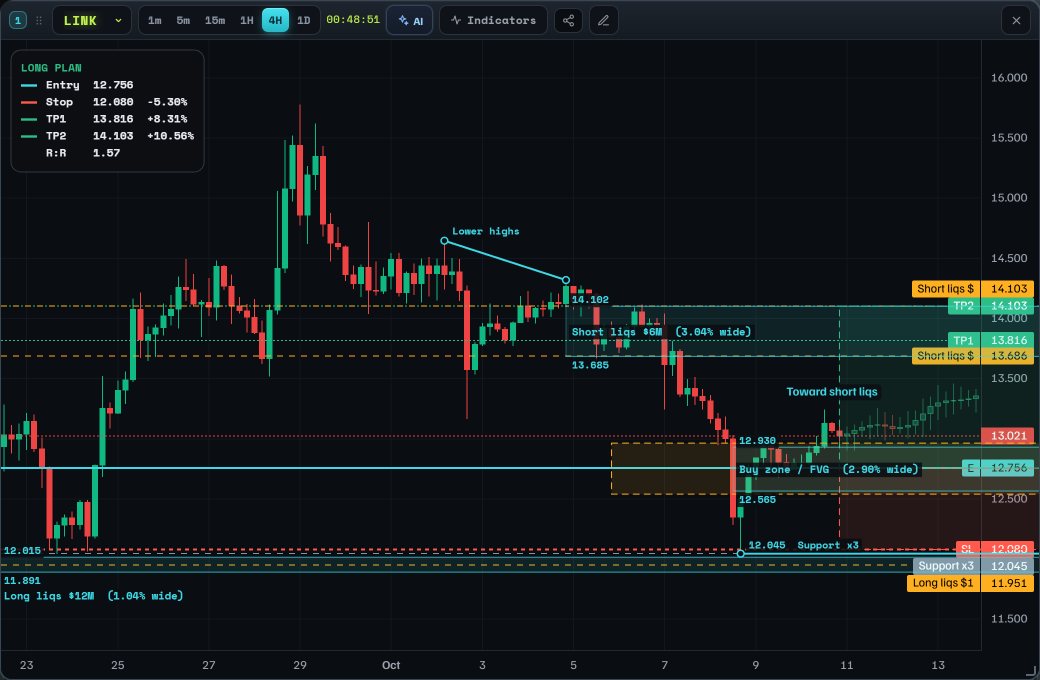
You askedShow me where the liquidation pools sit and what they mean for a trade.LINK · 4h
What it didDrew 6 shapes
LONGconfidence 58%
Entry
12.756 -2.04% from the price when asked
Stop
12.08 -5.30%
Target 1
13.816 +8.31%
Target 2
14.103 +10.56%
Reward to risk
1.57 acceptable
LINK, 4-hour: the fuel is stacked both ways, but it's lopsided below — wait for a dip to buy.
It draws the trade and prints the arithmetic. Long from 12.756, stop 12.08, targets 13.816 and 14.103 - reward to risk 1.57 written on the block. On the chart: a trend line, 3 zones, a level, labelled “Lower highs”, “Buy zone / FVG”, “Short liqs $6M”.
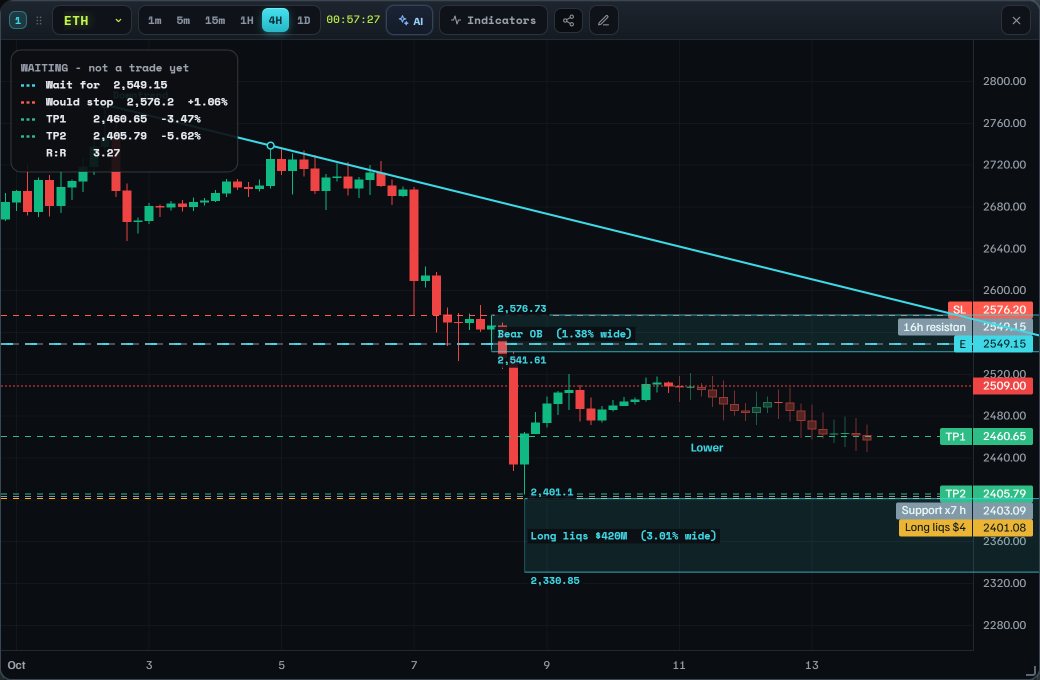
You askedFind me an opportunity here and draw it on the chart.ETH · 4h
What it didDrew 4 shapes
WAIT - not a trade yetconfidence 62%
Waiting for
2,549.2 +1.60% from the price when asked
Would stop
2,576.2 +1.06%
Would target 1
2,460.7 -3.47%
Would target 2
2,405.8 -5.62%
Reward to risk
3.27 well paid
ETH, 4-hour: the opportunity is a short into 2549, not a buy here.
A wait is an answer - with a price on it. It declines the trade and marks what it is waiting for at 2,549.2, with the stop and target the trade would carry if that level is reached. On the chart: a ray, 2 zones, labelled “Downtrend”, “Bear OB”, “Long liqs $420M”.
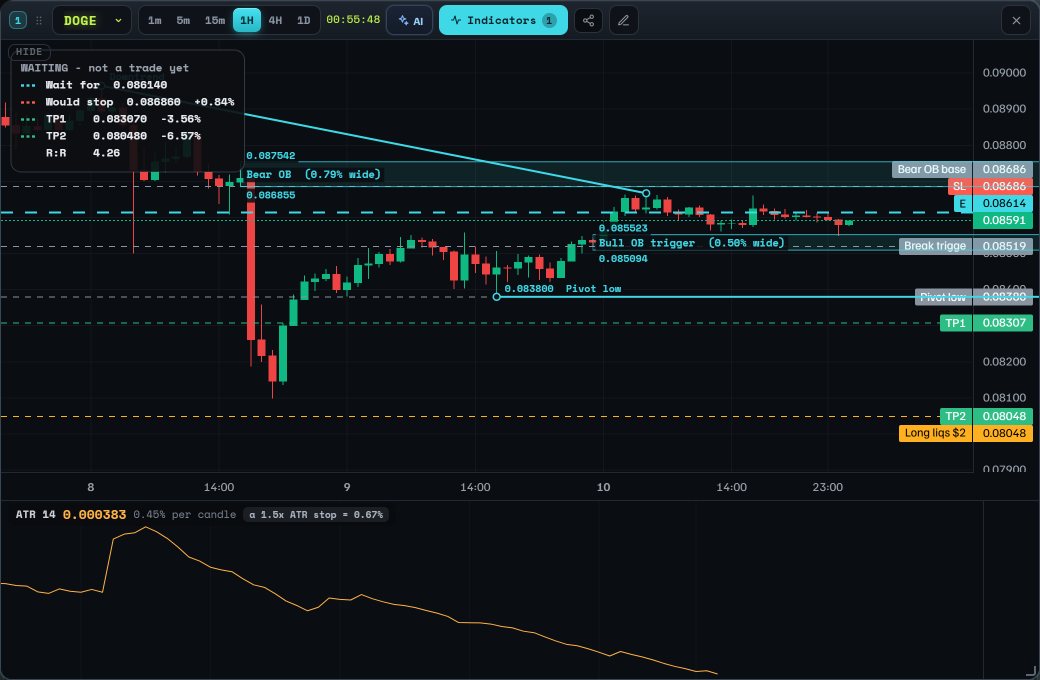
You askedIs there anything worth taking here right now? Draw your answer.DOGE · 1h
What it didOpened ATR (14) · Drew 4 shapes
WAIT - not a trade yetconfidence 62%
Waiting for
0.08614 +0.27% from the price when asked
Would stop
0.08686 +0.84%
Would target 1
0.08307 -3.56%
Would target 2
0.08048 -6.57%
Reward to risk
4.26 well paid
DOGE 1-hour: nothing to take yet — this is a squeeze, wait for the break.
A wait is an answer - with a price on it. It declines the trade and marks what it is waiting for at 0.08614, with the stop and target the trade would carry if that level is reached. On the chart: a trend line, 2 zones, a level, labelled “Downtrend”, “Bull OB trigger”, “Bear OB”.
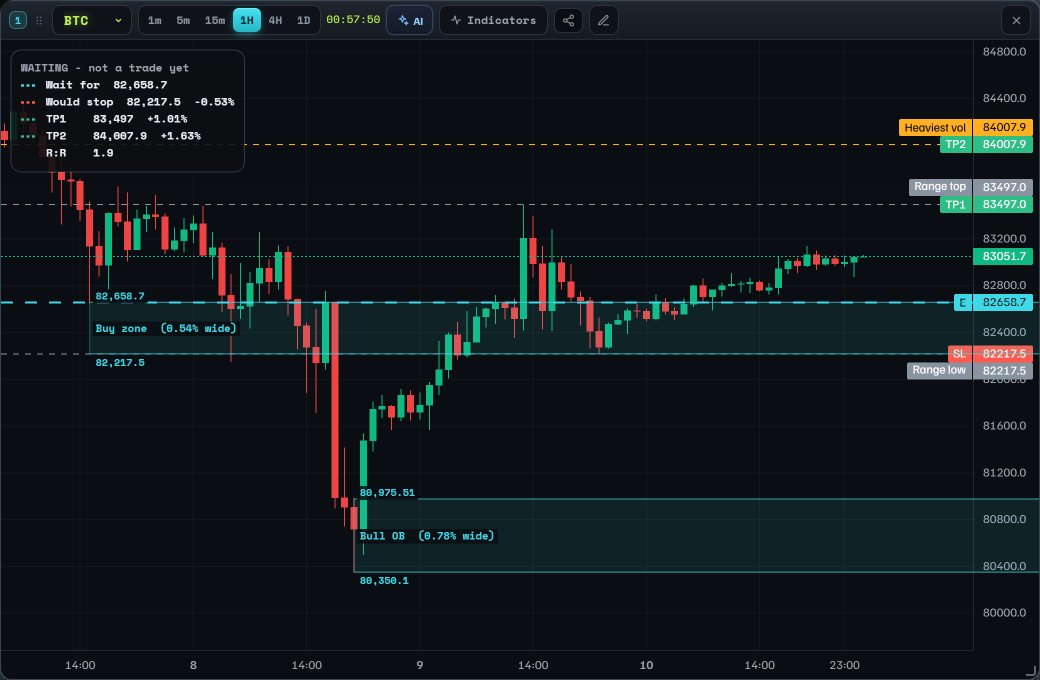
You askedRead this chart and draw the setup on it.BTC · 1h
What it didDrew 2 shapes
WAIT - not a trade yetconfidence 58%
Waiting for
82,658.7 -0.47% from the price when asked
Would stop
82,217.5 -0.53%
Would target 1
83,497 +1.01%
Would target 2
84,007.9 +1.63%
Reward to risk
1.90 acceptable
BTC 1-hour: coiled and going nowhere — this is a wait.
A wait is an answer - with a price on it. It declines the trade and marks what it is waiting for at 82,658.7, with the stop and target the trade would carry if that level is reached. On the chart: 2 zones, labelled “Buy zone”, “Bull OB”.
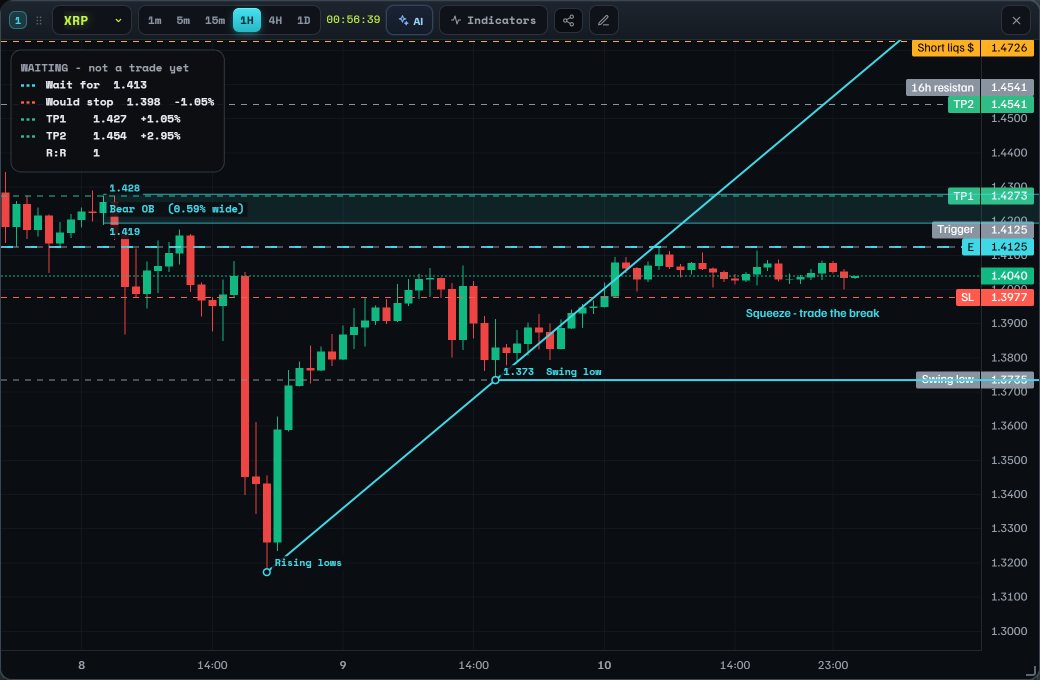
You askedMark the structure and the levels that actually matter here.XRP · 1h
What it didDrew 4 shapes
WAIT - not a trade yetconfidence 58%
Waiting for
1.4125 +0.61% from the price when asked
Would stop
1.3977 -1.05%
Would target 1
1.4273 +1.05%
Would target 2
1.4541 +2.95%
Reward to risk
1.00 risks more than it makes
1-hour XRP: coiled and undecided — mark it, don't trade it yet.
A wait is an answer - with a price on it. It declines the trade and marks what it is waiting for at 1.4125, with the stop and target the trade would carry if that level is reached. On the chart: a ray, a level, a zone, labelled “Rising lows”, “Swing low”, “Bear OB”.
Captured from the live product, untouched; the cards are read out of the same answers. Individual reads, not a track record - Ask AI is a research tool and it will be wrong plenty of times. Nothing here is financial advice.
How to use it, in three steps
Open Charts. Pick any coin and any timeframe - the AI reads the exact chart you are looking at, so what you choose is what it answers about.
Press the AI button at the top of the chart. It sits in the toolbar beside the timeframe and the indicators, and it opens a chat panel on the right (a sheet from the bottom on a phone).
Ask in your own words. "Find me an opportunity here", "where is my stop?", "draw the setup", "what is RSI?" - in any of the 13 site languages. It answers, and when you ask it to draw, it draws on the chart itself.
It can also work the chart for you: switch the timeframe, open an indicator, jump to another coin. Your conversation is kept per coin, so closing the panel or coming back tomorrow picks up where you left off. Each answer ends with an entry, a stop, targets and the reward-to-risk - and it says so plainly when the honest answer is to wait.
QUESTIONS
Good to know
What exactly do I get?
Every Premium feature above - the 6 exclusive AI indicators, the full liquidation heatmap, Ask-AI on charts (five reads a day; 50 a day on Premium AI+), Balance Mode, all five duel formats and the Premium lounge, the Daily Brief, +5% XP, the Premium badge, position alerts and the full trading report on the site. New Premium tools are added over time at no extra cost.
Does Premium include the Bot API?
No. Since 15 September 2026 the Bot API is a separate product with its own plans - Free, Pro ($39/month), Max ($99/month) and Business ($199/month) - and a Premium subscription does not change any API limit. It works the other way too: an API plan does not unlock the Premium features on this page. See the API plans →
How do I pay?
In crypto - Bitcoin, USDT or any major coin - through NOWPayments. We never hold a private key or store card details. Access turns on the moment your payment confirms.
Can I cancel?
Yes. Monthly simply doesn't renew if you don't pay again - there's nothing to cancel and no lock-in.
Is this financial advice?
No. Everything on MarginPad is educational and for paper trading. The indicators analyse data and will be wrong sometimes - they're an edge, not a guarantee.
The 6 AI indicators
Five readouts built on data only MarginPad has - our own liquidation feed, the leverage ladder behind the heatmap, funding and crowd positioning - each answering one question you should ask before opening a position. Every arrow indicator also grades itself on the loaded chart (1.5x ATR target vs stop) and prints its own hit-rate, so you can see when it works here and when it does not.
Cascade Radar FRAGILITY
How easy is it for the market to fall (or rise) in a chain right now?
You see: one line from 0 to 100 under the candles, with a marker at 90, and a legend line that says which side the fuel sits on.
It means: under 50 the market is calm and this indicator has nothing to say. Rising past 70 it is fragile: enough leveraged positions sit close to price that one push can force-close them and the next ones in a chain. The legend tells you where the chain would run: fuel BELOW = it is longs that would be liquidated (price can fall fast), fuel ABOVE = shorts (price can squeeze up fast).
Before a long: line above 70 and fuel below = you would be buying on top of a trapdoor; wait for the flush, or take half size with a wider stop. Fuel above = the squeeze would run in your favour. Before a short: the mirror - fuel below is your target zone, fuel above means you are the one standing on the trapdoor. The arrow: red CASC over a candle = chain primed downwards; green CASC under a candle = primed upwards.
Big Liquidations (24h) REAL EVENTS, NOT A MODEL
Where has leverage actually been force-closed in the last 24 hours - and what happens when price goes back there?
You see: circles on the candles, at the exact price and the exact candle where a big liquidation happened in the last 24 hours. Red = a long was force-SOLD there. Green = a short was force-BOUGHT there. The bigger the circle, the bigger the position. Tap one for its size, the side in words, the venue it happened on and how far that price is from the price now.
It means: every other liquidation indicator you can buy anywhere is a guess, because the scripting languages on other charting sites cannot reach a liquidation feed at all. These are not guesses and not forecasts - they are events our own collector recorded across eight exchanges. Where they cluster is where leverage actually died: that is where the stops sat, and where the market proved somebody was offside. A band of red circles under a drop is the cascade that caused it. It covers the ten coins our feed records - BTC, ETH, SOL, XRP, DOGE, BNB, ADA, LINK, AVAX and LTC; on any other market it cannot be switched on and says it has no data.
Before a long: price coming back DOWN into a thick band of red circles is arriving where forced selling already happened once - either it gets absorbed and that is your level, or it breaks and the same thing happens again. Green circles above you mark where shorts were squeezed out, so a move back up through them has fuel behind it. Before a short: the mirror. Shorting into a band of green circles is shorting where shorts were already force-closed once. An empty chart means the market has been calm - which is information too.
Liquidation Magnet TARGETS
Where is price likely to go and touch next?
You see: two horizontal lines on the price - a red one above (where shorts get liquidated) and a green one below (where longs get liquidated). The bold one is the stronger magnet; each carries its size in dollars.
It means: price is drawn to the bigger pool of forced orders first, because forced orders move a market that nobody else is moving. The bold line is the likelier next visit, and the legend prints how far away both are.
Before a long: bold line above you = your first target, take some profit there. Bold line below you = expect a dip to it first; put your stop under that line, not just above it, or you are the order that gets hunted. Before a short: the mirror - bold green line below is the target, bold red line above means keep the stop beyond it. No lines: both sides were already flushed; nothing is pulling, expect a slower market.
Market Brain ADAPTIVE
Which way does the evidence lean, and how much should you trust it here?
You see: a line from -100 to +100 with two bands at +55 and -55, a legend line "driven by: X + Y", and a chip like BRAIN 58% (14W/10L).
It means: the line going up = the evidence is leaning bullish, going down = bearish. It blends eight things (trend, momentum, volume, fragility, real liquidations, funding, crowd positioning, structure) and, every few candles, re-checks which of them actually predicted this coin on this timeframe, so a factor that does not work here counts for nothing. Inside the bands the model has no strong opinion. "Driven by" names the two reasons behind the number.
Before a long: you want the line above +55, or rising through it. Below -55 you are trading against the learned evidence - do not. Before a short: the mirror, below -55. Inside the bands: no edge here - size down or use the Magnet levels instead. The chip: the percentage is how often its arrows worked on this exact chart. Under 50% = the model has no edge on this coin and timeframe; ignore its arrows there, whatever the line does.
Market Memory FORECAST
The last 25 times it looked like this, what happened next?
You see: a purple line under the candles (the expected move), a dashed MEM line on the price at the projected level, and a legend like 25 analogs · 72% up · proj +1.4% / 6 bars.
It means: it found the 25 past moments that most resembled right now and reports what price did in the six candles after them. 72% up and +1.4% = most of those moments went up, by about that much. It is a base rate, not a call.
Before a long: 65% up or more AND a projected move bigger than your fees and stop = go, with the MEM line as a realistic target and six candles as the horizon (six hours on a 1h chart). Before a short: the mirror, 35% up or less. 45-55%: history went both ways from here - a coin flip. Stay out, or trade the Magnet levels instead of a direction. The arrow: MEMO fires only when the analogs agree; it is the strongest form of this readout.
What moved it (30d) CAUSES, DATED
Why did price just jump or drop - and which of this month's moves had a reason behind them?
You see: a flag on the candle where every abnormal move of the last 30 days started, with its size and its cause in one word - CPI, FOMC, Bybit delisting, Hack, ETF, Cascade, Whale, BTC move - or a grey question mark when nothing dated explains it; a lime LIVE flag while a move is forming now; a legend that says how many of the month's moves were explained. A tap opens the evidence: the headline, its source, how many minutes before the move it was published, the score, what was liquidated meanwhile.
It means: the cause comes from our Catalyst Engine (exchange announcements, filings, the macro calendar, the fast news desks, with each item's own timestamp), from our liquidation feed, from the whale tracker and from Bitcoin itself - matched by symbol and by time, and checked against a placebo. A move is judged against the coin's own volatility, never a fixed percent.
Before a long: a rise with a dated reason is a move whose reason you can check; a rise marked ? is flow, and flow reverses. Before a short: a drop marked Cascade is forced selling that exhausts itself; a drop with news keeps its ground.